
EV Adoption Without Incentives: Florida Tells the Story
- Pete Westlake
- Feb 11
- 2 min read

As we enter January 2026, one prediction has clearly missed the mark: the idea that electric vehicle adoption would stall once incentives expired.
In Florida, EV registrations continued to rise through the final quarter of 2025—growing by roughly 6% statewide, even as incentives fully sunset. This marks the first full quarter of incentive-free growth, and the results are telling. As you can see below growth is happening across the state even in the rural counties.
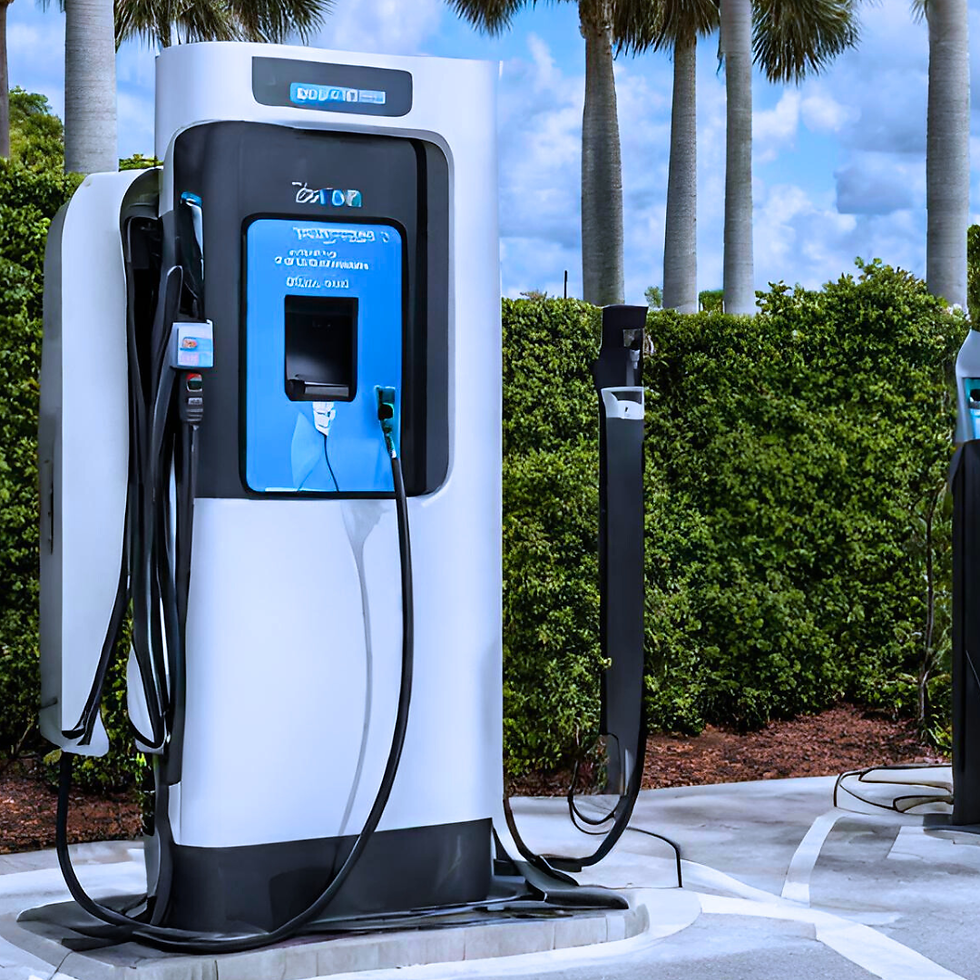
Just as important, charging infrastructure has expanded alongside vehicle adoption, keeping pace with demand. What’s especially encouraging is where that growth is occurring. This is no longer just an urban story. Rural EV adoption has reached sufficient density that it now shows up clearly in statewide mapping and planning data—an important milestone for equitable access and long-term resilience.
For some time, it has been evident that light-duty EV incentives were nearing the end of their useful life. As vehicle prices approach parity, market forces—not subsidies—are increasingly driving adoption. At that point, continued government intervention offers diminishing returns.
Where support is still needed is in the medium- and heavy-duty segments (Class 4–8). These vehicles have not yet reached the production volumes necessary to unlock the same cost declines seen in light-duty models. However, there is reason for optimism. Battery technology—the single largest factor delaying parity in Class 3 and below—continues to improve rapidly, and those advances translate directly to heavier vehicle classes.
The progress being made today in light-duty EVs is laying the foundation for tomorrow’s gains in trucks, buses, and vocational fleets.

Although Tesla continues to dominate the market we are seeing greater numbers of other brands show up and leave Tesla with a 50% market share. The % of EVs related to total registrations continues to grow averaging 4% in major markets.

Charging infrastructure continues to grow with over 4,000 high speed public chargers representing approximately 1 port per 200 EVs registered.

Electric transportation in Florida is no longer an experiment or a policy-driven anomaly. It is a growing, self-sustaining market—and in one of the nation’s largest and most diverse states, that growth is worth watching closely.
At this point the future of EVs still looks bright. Drive clean, Drive EV!
Note: Statistics provided by Orlando Utilities Commission.


Comments